
3 useful Power BI reports for companies in the construction industry
Construction companies using an ERP solution hold valuable data. Information on past projects, for example, but also invoices, purchase orders, and schedules, are somewhere in a database. This immediately brings us to the challenge many construction company managers, controllers, and directors face: how do you get this information and use it intelligently? You can read about that here.

The past as a guide to the future
It is wise to look back at the past to make sound business decisions. Which past decisions yielded positive results? What is the average turnaround time of service orders? How do I plan resources efficiently based on recurring seasonal trends? This sounds very logical, but it is a complex task. Data analysis with the approachable Microsoft Power BI can help you with this.
Power BI in a nutshell
You probably already know Power BI. It is a tool within the Microsoft Power Platform that helps companies analyse and visualise data. In doing so, Microsoft pays much attention to user-friendliness and ease of use. To get started with Power BI, you do not need to be a data analyst or be able to build complicated queries.
Do you use an ERP solution based on Microsoft technology, such as our total solution 4PS Construct? Then you can build a dashboard based on data from your ERP without too much fuss. This blog lists three Power BI reports that give you more insight into how your construction company is performing.
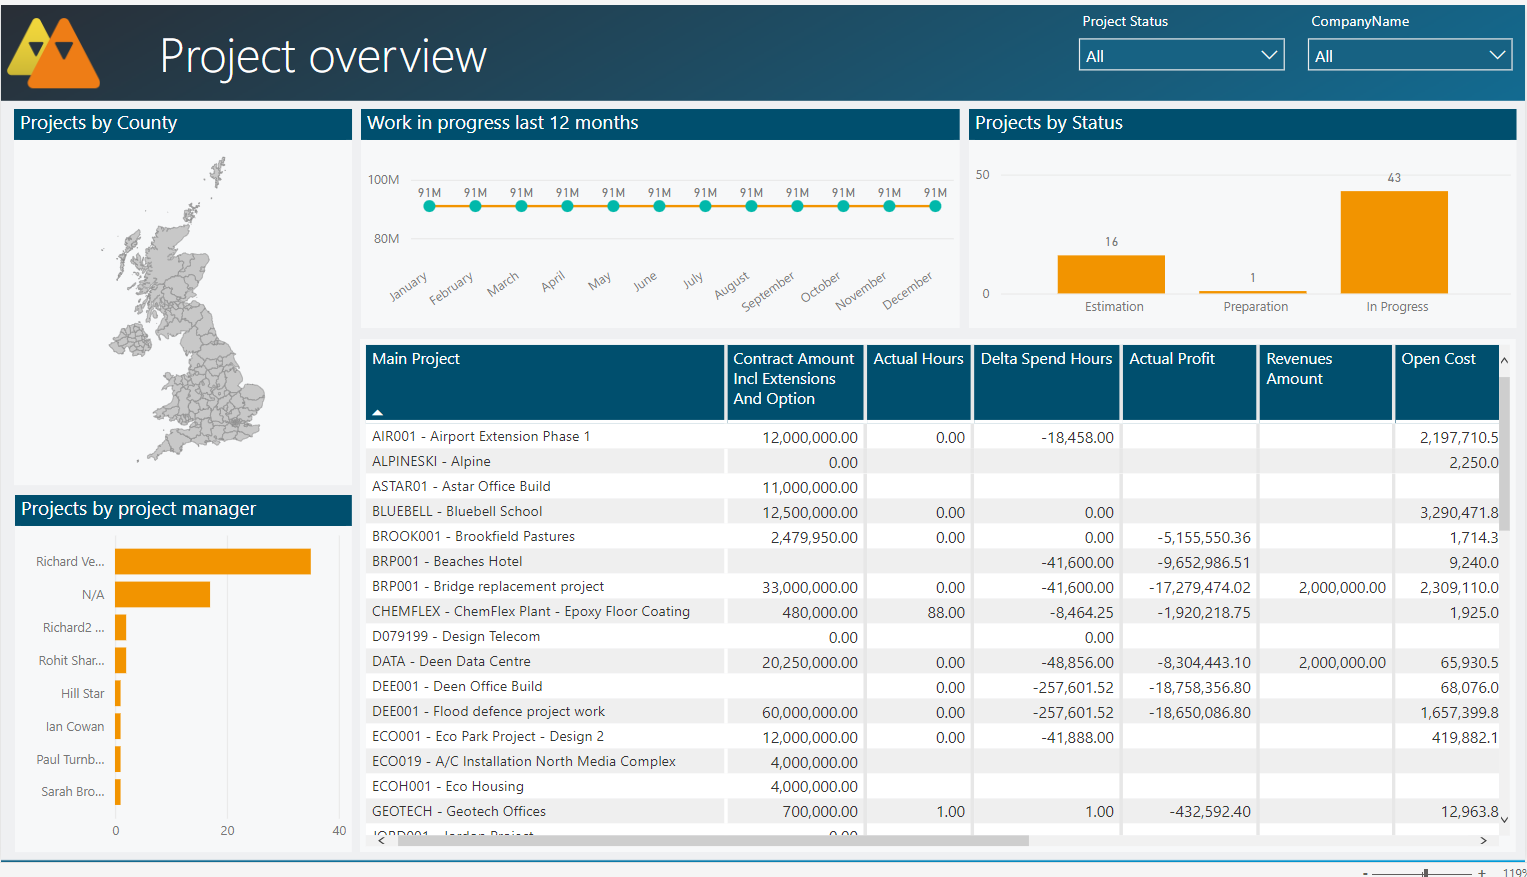
1. Project overview: where are we?

Based on data from our ERP solution 4PS Construct, this dashboard shows the company’s risks in pre-financing projects. This is demonstrated by deducting the invoiced amount from the costs incurred in work in progress. The result is a helpful guideline for project managers to make quick adjustments where necessary.
Is work in progress for a project showing in the red? Then you know it is time for action. For that project, check how long invoices have been due and which ones you still have to send. Or focus on the ‘Financing balance’ in the report. It is a handy dashboard for project managers to review weekly and take immediate action where necessary. This prevents a lot of unpleasant surprises (and budget overruns) at the end of the project.
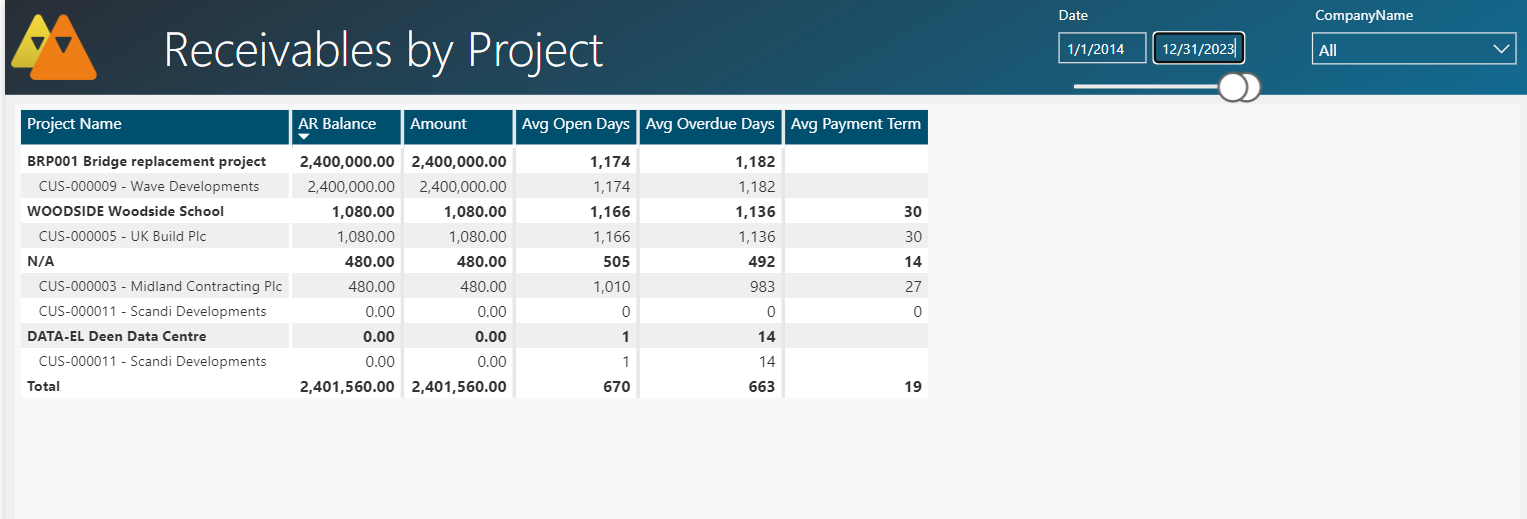
2. Debtors: who pays on time?

The debtors per project report show the debtor balance within a project. This a logical step after looking at the work in progress earlier. Here, the focus is on the payment terms of the project. Why are invoiced amounts still outstanding? That’s what you want to know.
For example, zoom in on the payment behaviour of debtors: does a customer always pay late, or can you expect payment after sending a reminder? You can quickly find this out by studying the KPI’s Average days outstanding and Average days past due. Want to know more? Then simply click through to the customer or invoice level from the project report. Handy, isn’t it?
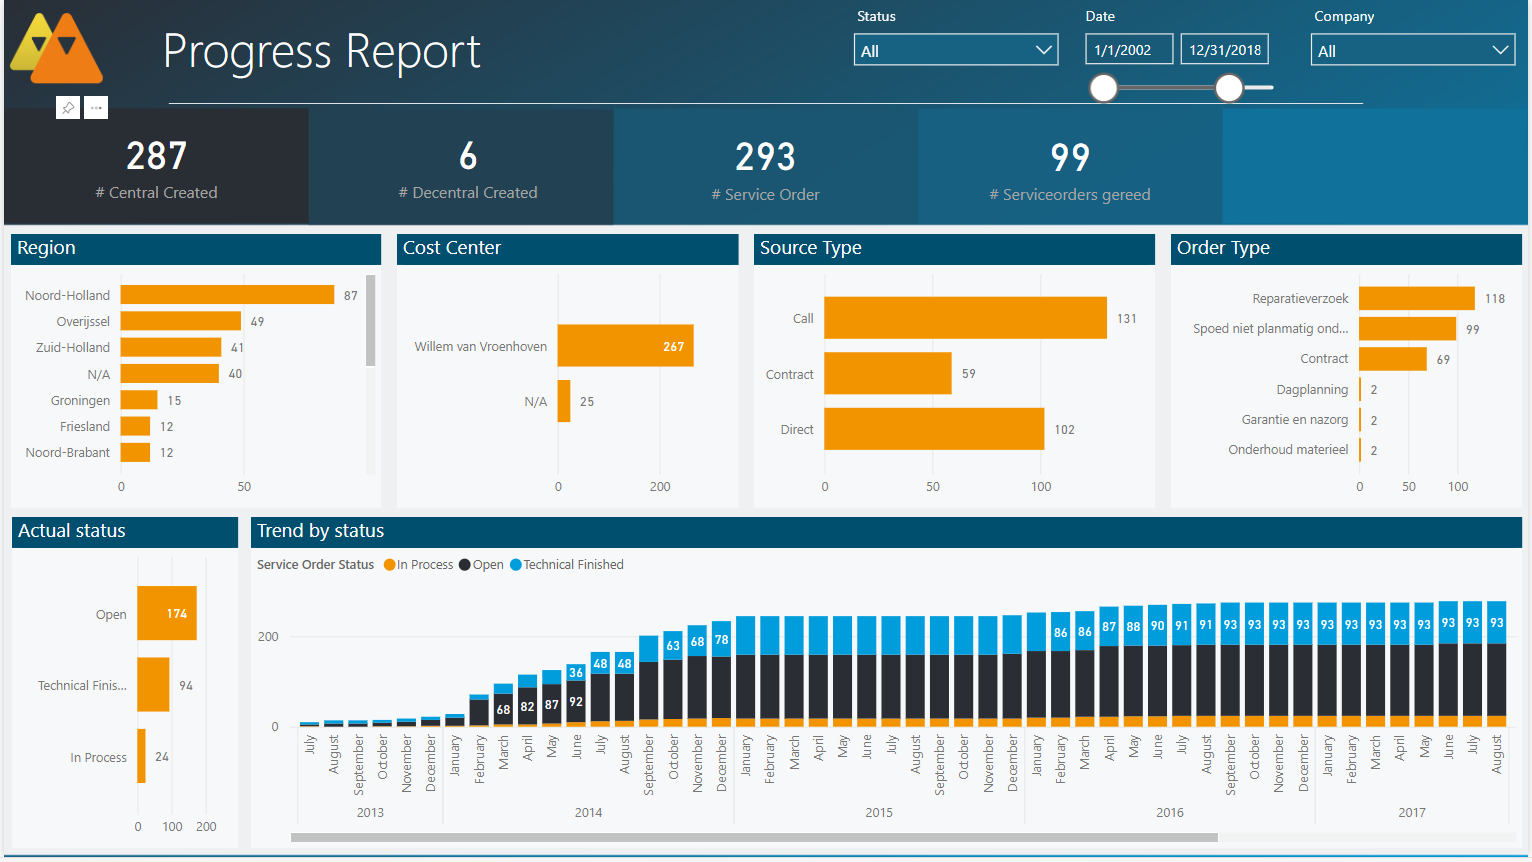
3. Service order: how well are we doing?

Does your company focus on service and maintenance work? Then it is beneficial to know the turnaround time of service calls. How much time elapses between receiving a notification and approving an order? The information helps you use available resources effectively and create realistic schedules.
Among other things, this dashboard shows you how often service orders are not resolved in one go. Important information because if a technician usually has to visit a customer a second time, this has consequences for planning and customer happiness. After all, customers have to wait longer for a solution to their problem.
This dashboard also shows which types of work often have longer lead times. For example, you can immediately see whether service orders with longer lead times are all in one region or come in through the same source.
Power BI platform for your industry: BIRDS
You will also find these dashboards in BIRDS, the user-friendly Power BI data platform for the construction industry. Our partner 9altitudes Business Analytics developed BIRDS, especially for companies with an ERP solution based on Microsoft technology. This makes it also the perfect BI solution for companies in construction who opt for our total solution 4PS Construct, built on Microsoft Dynamics 365 Business Central.
The BI Content Packs in BIRDS contain various standard reports, allowing you to start with Power BI immediately and quickly start making data-driven decisions.
Would you like to know more about the importance of data-driven decisions for your construction company? Then read our white paper “Five Reasons to be Data-Driven in Construction” and get more from your business data.
-
Share:

Elliot Herdman | Elliot has over 20 years experience in the construction industry working with main contractors, subcontractors, M&E, supply and install analysing their business processes and implementing digital software solutions to improve projects, drive efficiencies and meet the growing needs of clients.
